
GTA home sales were down 7.9% from last year, and new listings fell even faster (−11.9%).
But prices held: the median price across the GTA was unchanged from September at $860,000.
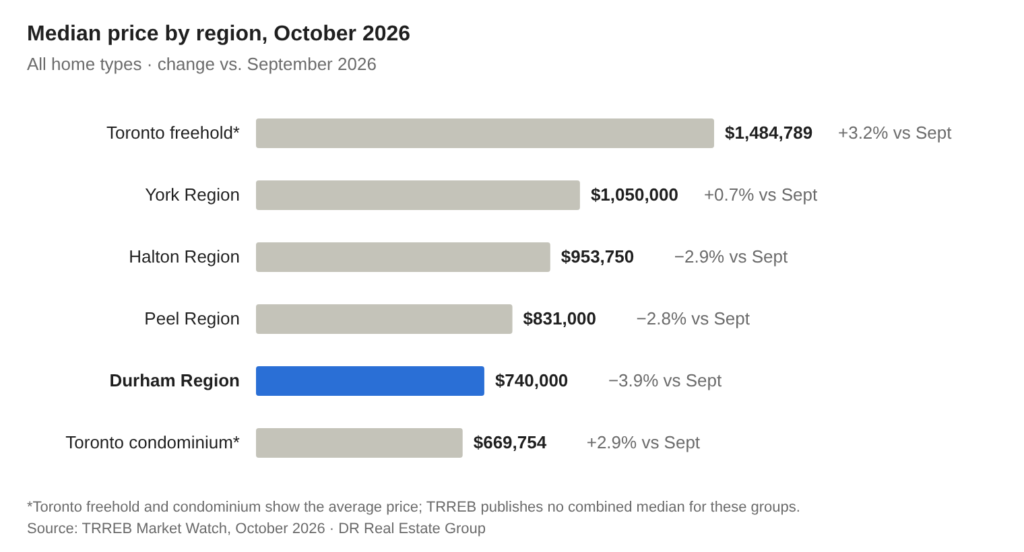
Durham Region remains the most affordable region in the GTA with prices lower by nearly 4%. Sales are also down 17.6%, the steepest drop of any region.
Prices and sales
| Area | Median price | MoM | YoY (benchmark)‡ | Homes sold | MoM | YoY |
|---|---|---|---|---|---|---|
| GTA (all TRREB areas) | $860,000 | 0.0% | −4.3% | 5,603 | +11.2% | −7.9% |
| City of Toronto | $835,000 | +3.1% | −3.6% | 2,184 | +12.8% | −7.1% |
| Toronto freehold* | $1,484,789 | +3.2% | −3.8% to −4.1% | 1,087 | +15.3% | +0.8%† |
| Toronto condominium* | $669,754 | +2.9% | −6.9% to −7.0% | 1,086 | +10.7% | −10.7%† |
| York Region | $1,050,000 | +0.7% | −6.8% | 1,038 | +16.2% | −1.1% |
| Peel Region | $831,000 | −2.8% | −4.6% | 1,017 | +8.7% | −7.3% |
| Halton Region | $953,750 | −2.9% | −1.1% | 592 | +17.9% | −14.7% |
| Durham Region | $740,000 | −3.9% | −5.1% | 589 | +6.7% | −17.6% |
Listings (supply)
| Area | New listings | MoM | YoY | Active listings | MoM | YoY |
|---|---|---|---|---|---|---|
| GTA (all TRREB areas) | 14,173 | −14.1% | −11.9% | 25,098 | −4.0% | −10.0% |
| City of Toronto | 5,451 | −16.4% | −9.0% | 9,526 | −3.4% | −8.0% |
| Toronto freehold | 2,341 | −20.1% | – | 3,505 | −5.5% | – |
| Toronto condominium | 3,074 | −13.2% | – | 5,940 | −2.2% | – |
| York Region | 2,663 | −14.3% | −12.0% | 4,932 | −4.6% | −10.1% |
| Peel Region | 2,462 | −7.5% | −15.4% | 4,368 | −5.7% | −15.6% |
| Halton Region | 1,361 | −21.5% | −17.7% | 2,485 | −5.3% | −13.1% |
| Durham Region | 1,700 | −7.3% | −5.1% | 2,619 | −0.1% | +1.9% |
How fast homes are selling
| Area | Sale-to-list price | Avg. days on market | Months of inventory |
|---|---|---|---|
| GTA (all TRREB areas) | 97% | 31 | 4.6 |
| City of Toronto | 98% | 30 | 4.6 |
| Toronto freehold | 97%–102% (by home type) | about 22 | 3.2† |
| Toronto condominium | 97% | about 37 | 5.5† |
| York Region | 97% | 33 | 5.0 |
| Peel Region | 97% | 33 | 4.9 |
| Halton Region | 96% | 34 | 4.2 |
| Durham Region | 98% | 29 | 3.6 |
Year to date (January–October)
| Area | Homes sold 2026 | vs. 2025 | New listings 2026 | vs. 2025 | Median price 2026 |
|---|---|---|---|---|---|
| GTA (all TRREB areas) | 52,694 | −2.1% | 145,345 | −14.7% | $870,000 |
| City of Toronto | 19,648 | −1.5% | 53,222 | −14.1% | $820,000 |
| York Region | 9,524 | +2.7% | 27,529 | −12.0% | $1,060,000 |
| Peel Region | 9,300 | +0.3% | 26,695 | −17.4% | $855,000 |
| Halton Region | 5,895 | −5.1% | 15,325 | −17.5% | $1,000,000 |
| Durham Region | 6,307 | −10.8% | 16,436 | −13.4% | $787,000 |
York and Peel are the only regions selling more homes this year than last, while Durham is down almost 11%, the steepest decline. Active listings are a month-end count, so they have no year-to-date total; the October count is in the listings table above.
Three Numbers Worth Knowing
- Durham sales fell 17.6% year-over-year (589 vs. 715), the biggest drop of any region. Durham is also the only area with more homes for sale than a year ago (+1.9%), and its median slipped 3.9% from September to $740,000.
- 2026 is tracking toward a record-low year. 2025’s 62,310 sales were the fewest in TRREB’s published annual records back to 2012. Through October, 2026 has 52,694 sales, 1.8% behind 2025’s pace. To match it, November and December would need about 11% more sales than last year.
- Halton held its value best. Its benchmark price is down just 1.1% from a year ago, compared with 6.8% in York, the steepest decline.
What’s Driving the Market
TRREB says both buyers and sellers are sitting on the sidelines, waiting for clarity on the economy, inflation and borrowing costs. That uncertainty grew late in the month: on October 28, the Bank of Canada raised its key rate to 2.50%, its first increase since July 2023, with inflation running at 3.1%. Bank prime rates rose to about 4.70%.
What This Means for You
Homeowners: Values are still below last year (the benchmark price is down 4.3%), but they’re firming up month to month. This looks like a market finding its floor, not falling further.
First-time buyers: You still have negotiating power. Condo apartments remain the most accessible entry point, averaging $621,400 GTA-wide, down 5.8% from a year ago. With rates rising again, getting pre-approved with a rate hold matters more than it did a month ago.
Move-up sellers: Detached prices are down 3.2% year-over-year, so the price gap to a bigger home is narrower than it was. Fewer new listings also means less competition when you sell. Durham is still the quickest market, with homes selling in 29 days on average and 3.6 months of inventory.
Investors: Condos are the softest segment: sales are down 10.4% and prices 5.8% from last year. If you have a variable-rate mortgage or a renewal coming up, the October rate hike is a good reason to update your cash-flow numbers.
Looking Ahead
TRREB expects the usual seasonal slowdown in November and December. The Bank of Canada’s next decision is on December 9, and any news on trade or inflation could shift buyer confidence either way.
Written by Saman Habibi, REALTOR®, CPA, CA.
Thinking about buying, selling or reviewing your investment property?
Contact DR Real Estate Group at admin@thedrgroup.ca or call (647) 849-0996 for a free home evaluation or consultation.